Below are instructions on how to navigate and utilize the “Projected Compliance Overview” function within the Graphium EMR Dashboard™ to review case counts, case admissibility to CMS, and Performance Met per MACRA measure.
Objective
-
Monitor case counts, case admissibility to CMS, and Performance Met per MACRA measure.
Goals
-
Monitor daily case counts by month and/or quarter.
-
Monitor whether cases submitted to Graphium are projected to be admissible or inadmissible to CMS for MACRA.
-
Monitor Performance Met by Measure in order to ensure your group/provider meets the minimum threshold to avoid a penalty for the reporting year.
Directions
Setup Projected Compliance Overview
-
Click here to login to the Graphium EMR Dashboard™. If you do not have access to the dashboard, please contact your organization's Administrator.
-
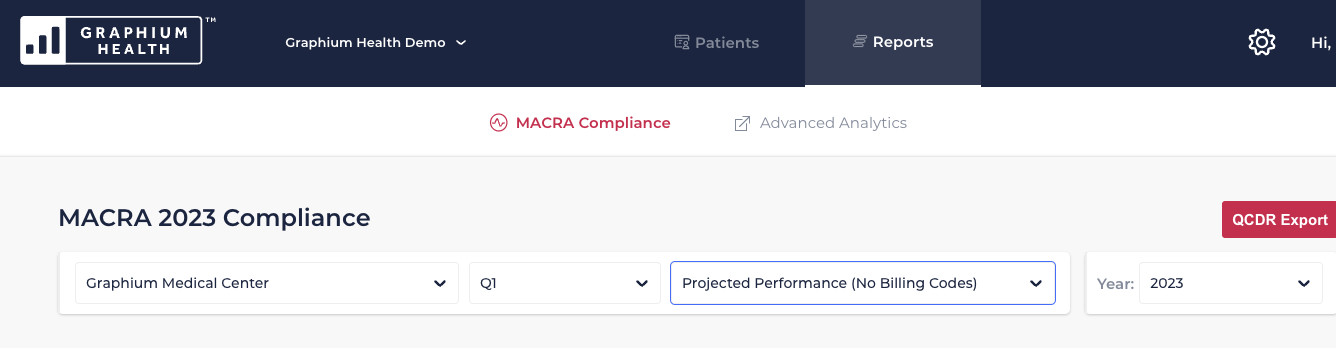
Click on “Reports” at the top of the screen and the MACRA Compliance interface should appear.
-
Select the facility you wish to review from the first drop down menu on the left hand side.
-
Select the month or quarter you wish to review case data for from the second drop down menu.
-
Select the method of Projected Performance (No Billing Codes or With Billing Codes) from the third drop down menu.
-
-
Projected Performance (With Billing Codes) provides projected admissible case status after including any billing code data already uploaded by your facility.
-
Projected Performance (No Billing Codes) provides projected admissible case status without including any billing code data.
-
-
-
Select the year you wish to review case data for, from the fourth drop down menu.
Review Total Case Count by Date
-
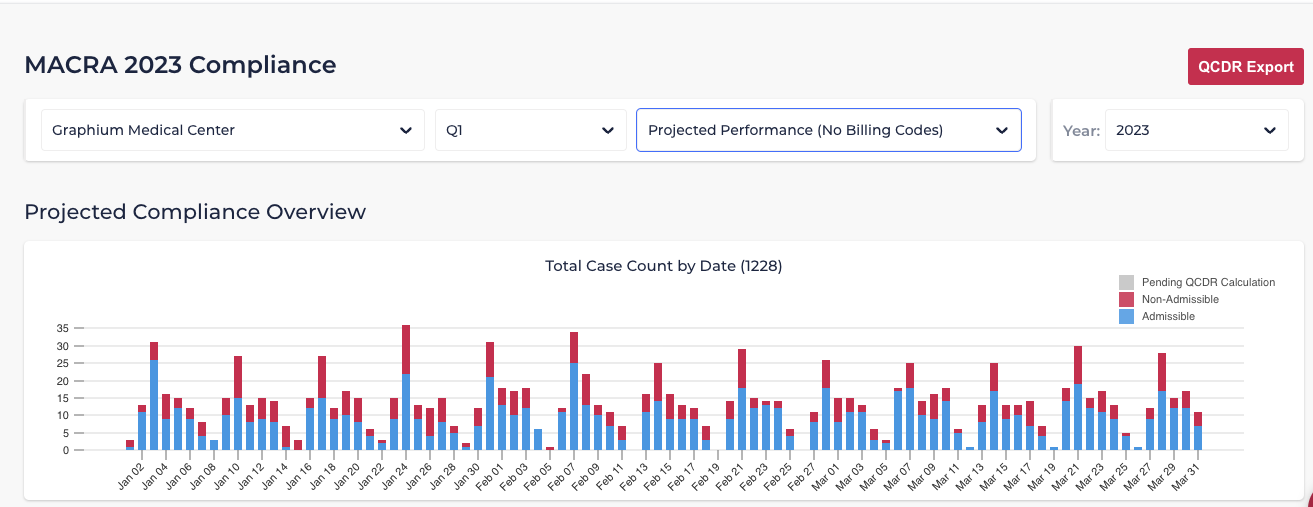
A bar graph will appear within the section titled “Total Case Count by Date”.
-
At the end of the title you will notice a number in parenthesis. That number is the total number of cases submitted to Graphium by your facility during the date range you selected.
-
You will notice inadmissible cases are charted in red, while admissible cases are charted in blue. Cases pending calculation in our system are charted in gray.
-
Cases may be marked inadmissible to CMS for a variety of reasons (i.e. invalid Surgeon or Anesthesiologist NPI, no Anesthesiologist information provided, etc.). For instructions on where to find inadmissible case details, please click the link below to review our Compliance Details help article.
Compliance Details Help Article
-
If you hover over an individual bar within the graph, the case count for that specific date will appear. Note: if you hover over the red section of the bar, an inadmissible case count will appear and if you hover over the blue section an admissible case count will appear.
Review Performance Met by Measure
-
Below the Total Case Count by Date section, you will see another bar graph titled “Performance Met by Measure”. As you can see by the blue color, this graph only reflects information related to admissible cases.
-
Each bar represents the total number of cases eligible for each of the 13 MACRA measures selected by Graphium for the reporting year. Labels for each measure are noted along the bottom of the graph (i.e. ABG40, ABG41, AQI56, etc.)
-
If you want detailed information regarding a specific measure, click the “Measure Definitions” tab at the bottom of the Performance Met by Measure section. A pop-up will appear allowing you to select and review each measure. Click “Ok” when you are finished and the pop-up will disappear.
-
Within each individual bar on the graph you will see your Performance Met Percentage for that particular MACRA measure. For detailed information regarding each MACRA measure’s percentage, please click the link below to review our Compliance Details help article.
Compliance Details Help Article -
If you hover over an individual bar, you will see the numerator and denominator used to calculate the Performance Met Percentage for that particular measure.
-
Pay attention to the denominator. In order to meet the minimum threshold and avoid a penalty, the denominator must be at least 20 points by the end of the reporting year, for at least 6 of the 13 measures. Note: it is wise to aim for more than 20 points in all eligible measures, but CMS will only consider the top 6 performing measures.
-
For more information regarding how to calculate Performance Met Percentage, how points are assigned to each measure, and the maximum number of points allotted for each measure, please click the link below to review a copy of the MACRA Ready Manual.
MACRA Ready Manual


