Below are instructions on how to navigate and utilize the “Compliance Details” section within the Graphium Dashboard to monitor individual provider’s case data, patient population data, quality care measures, adverse outcomes, and patient survey data.
Objective
-
Navigate and utilize the “Compliance Details” section within the Graphium Dashboard.
Goals
-
Monitor case data, patient population data, quality care measures, adverse outcomes, and patient survey data for a specified MACRA reporting period.
Directions
Setup Compliance Details
-
Click here to login to the Graphium EMR Dashboard™. If you do not have access to the dashboard, please contact your organization's Administrator.
-
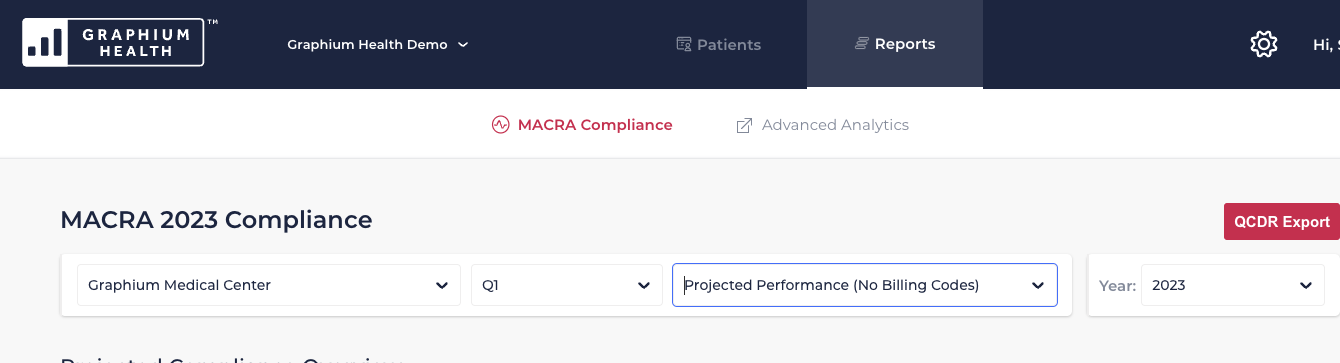
Click on “Reports” at the top of the screen and the MACRA Compliance interface should appear.
-
Select the applicable year you wish to review from the dropdown menu on the right hand side.
-
Select the facility you wish to review from the first dropdown menu on the left hand side.
-
Select the month or quarter you wish to review from the second dropdown menu.
-
Select the method of Projected Performance (With Billing Codes or No Billing Codes) from the third dropdown menu.
-
-
Projected Performance (With Billing Codes) will provide projected admissible case status after including any billing code data already uploaded by your facility.
-
Projected Performance (No Billing Codes) will provide projected admissible case status without considering billing code data.
-
Review Summary By Provider
-
Scroll down to the bottom of the page and you will find the “Compliance Details” section.
-
Click on the “By Provider” tab to bring up a summary of compliance data organized by provider.
-
The Form Completion Percentage column shows how many forms a provider has successfully completed. If the percentage is green and 100%, it means the provider completed all required fields within their forms. If the percentage is red and less than 100%, it means the provider did not complete all required fields within their forms and could potentially lose benefits gained from reporting all measurable data.
-
The Admissible Percentage column shows how many of the cases submitted by each provider to Graphium are admissible to the QCDR for CMS. For instance, if out of 184 cases only 122 are admissible to the QCDR, then 66% are admissible. Note: during each MACRA reporting period, providers are required to attest to reporting 100% of cases to CMS.
-
Each MACRA measure has its own unique column. The percentage of eligible cases for each measure by provider, can be found within those columns.
-
If you would like to export the summary for further use at your facility, click the “Download CSV” button.


Review Case Compliance Data
-
Click on the “Cases” tab to bring up a detailed view of all cases submitted by each provider.
-
Choose the provider you wish to review from the dropdown menu on the left.
-
For each case, the table provides encounter number, date of service, associated providers, form completion percentage, admissibility, form errors, MACRA measure eligibility, and an actions function which allows you to view a copy of the record and further details.
-
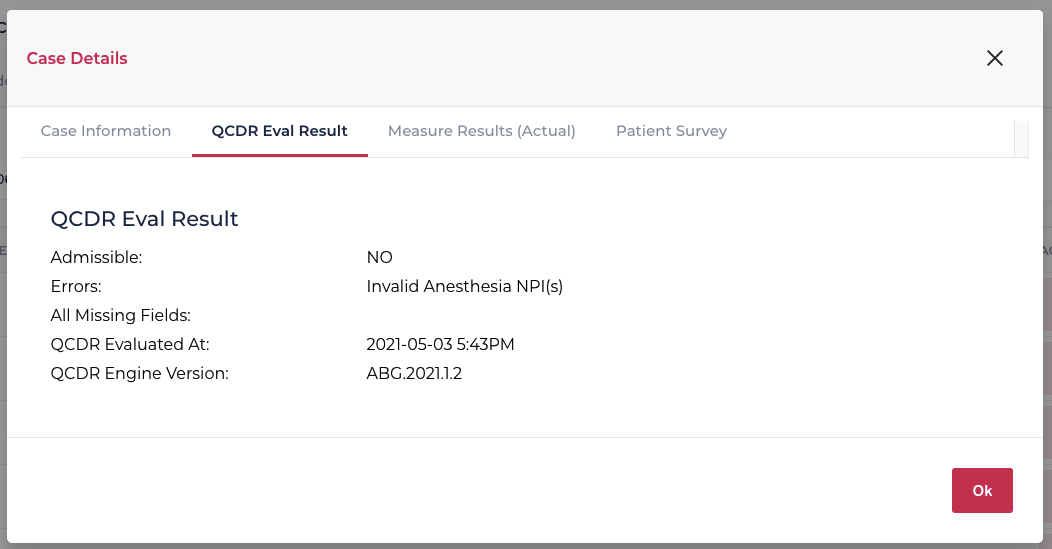
If a case is inadmissible (shows NO under the Admissible column), look under the “Errors” column for a detailed reason (i.e. Invalid Surgeon NPI, Invalid Anesthesiologist NPI, No Anesthesiologist Information, etc.).
-
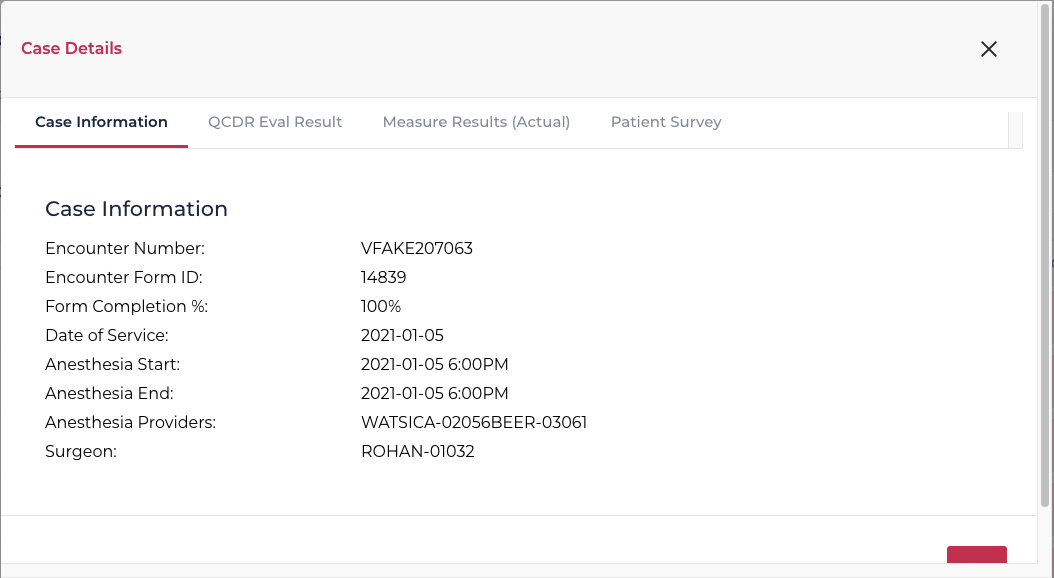
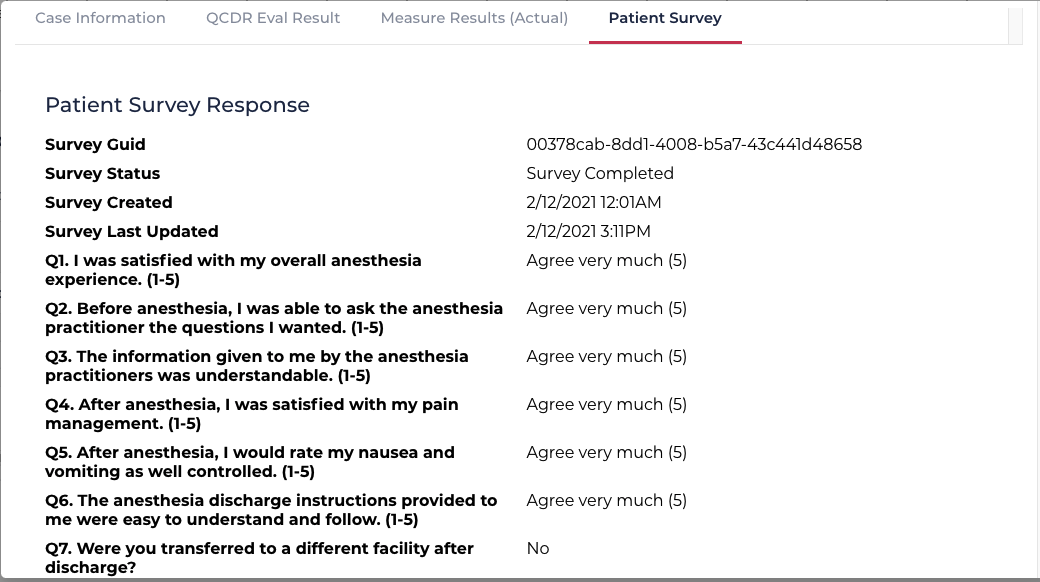
For inadmissible cases, you can also click on the red “Actions” icon to the far right for further details. A “Case Details” window will pop-up.
-
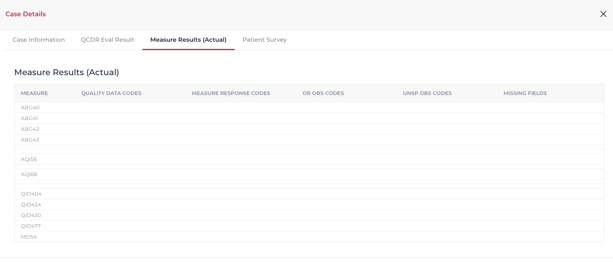
You can then navigate between Case Information, QCDR Evaluation Results, Measure Results, and Patient Survey data.
-
When reviewing eligibility of MACRA measures for a case, you may notice any of the following symbols. Note: the below legend can be accessed by clicking on the “Legend” tab at the bottom of the Compliance Details section. Simply click Ok to close the Legend.
-
If you would like to filter a provider’s case results based on data contained within the table, simply click the “Filter Table” magnifying glass in the top right corner of the table and enter in your filter request.


Review Patient Population Health
-
Click on the “Population Health” tab to bring up data related to multiple patient demographics. Note: the data shown is based on the time period and facility you originally selected.
-
During each MACRA reporting period, providers are asked to identify and attest to specific improvement activities which they performed for 90 days or more. The “Population Health” tab helps provide facilities with data to monitor for several of those improvement activities.
For detailed information regarding improvement activities please click the link below to review our QCDR Provider Registration help article.
QCDR Provider Registration Help Article
Review Quality Measures
-
Click on the “Quality” tab to bring up completion percentages for the following five quality related measures. Once again, the data populated will be based on the time period and facility you originally selected.
-
-
Handoff Protocol Used
-
Post Op Pain Control
-
Normothermia
-
Safety Checklist Used
-
Current Meds Documented
-
-
-
As with Population Health, Quality measures help provide facilities with patient safety data to monitor as a basis for MACRA related improvement activities.
For detailed information regarding improvement activities please click the link below to review our QCDR Provider Registration help article.
QCDR Provider Registration Help Article
Review Adverse Outcomes
-
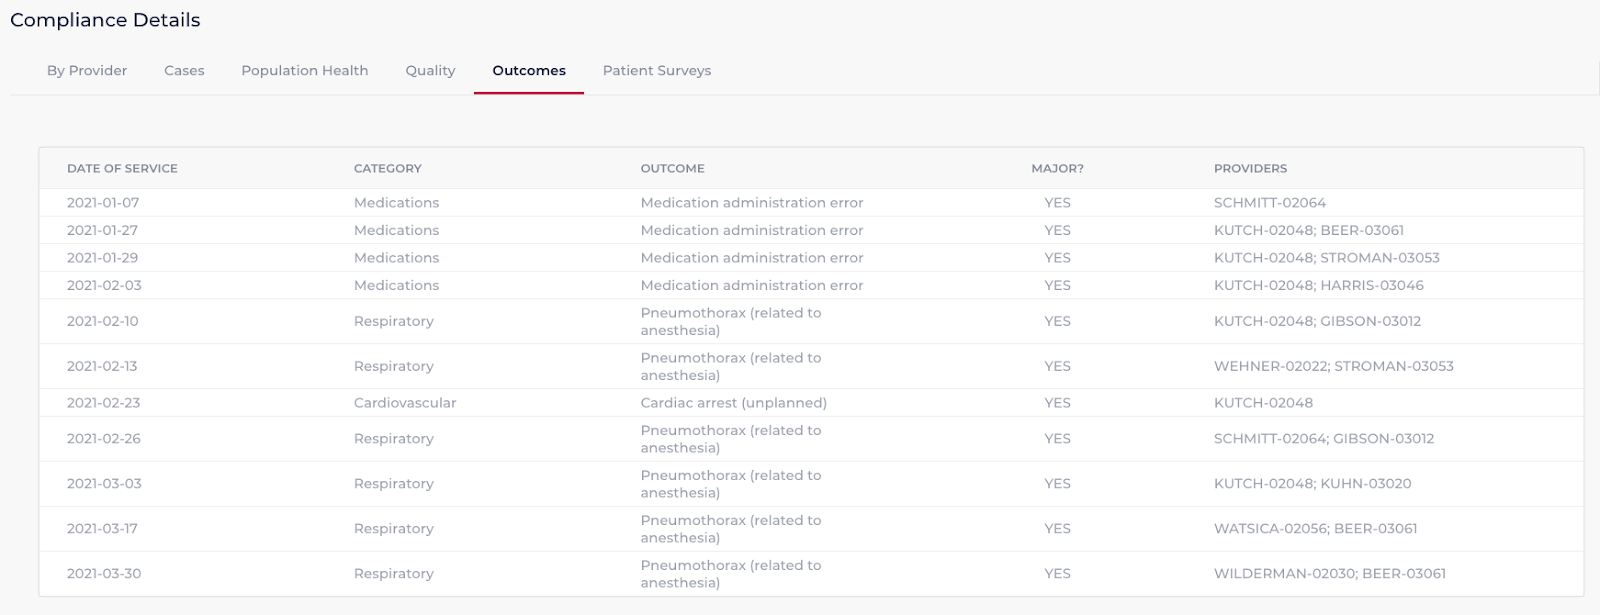
Click on the “Outcomes” tab to bring up a list of adverse outcomes which occurred. Once again, the data populated will be based on the time period and facility you originally selected.
-
The list includes date of service, type of outcome, details of the outcome, whether the outcome is classified as major, and providers associated with the case.
-
Outcome data also helps facilities monitor patient safety data as a basis for MACRA related improvement activities.
For detailed information regarding improvement activities please click the link below to review our QCDR Provider Registration help article.
Review Patient Surveys
-
Click on the “Patient Surveys” tab to bring up patient survey data for each provider. Once again, the data populated will be based on the time period you selected.
-
The table includes provider name, number of surveys distributed to patients, number of surveys opened, number of surveys patients attempted to complete, number of surveys patients completed, and average response grade for each survey question.
-
For a detailed view of each question included within the survey, simply click the “Survey Details” tab in the top right corner of the table.
-
You can also export a summary of all the survey data by clicking the “Download CSV” tab in the top right corner of the table.
-
Survey data helps facilities monitor patient satisfaction as a basis for MACRA related improvement activities. Note: question # 1 within the patient survey (satisfaction with overall anesthesia experience) directly correlates to the AQI48 MACRA measure mentioned above. For more detailed information regarding how AQI48 is measured, please click the link below and reference “Measure Definitions”.
Projected Compliance Overview Help Article
For detailed information regarding improvement activities please click the link below and reference "improvement activities".
QCDR Provider Registration Help Article
